
Inspecting elements is an essential skill that allows anyone to understand how a website is built and to make necessary adjustments. You don’t have to be a web developer to benefit from inspecting elements on a Mac with any modern browser with just a few simple clicks. Fortunately, inspecting elements is a built-in tool in all modern browsers, and you don’t need any special software to do it. This tutorial provides step-by-step instructions on how to inspect elements in Safari, Chrome, and Firefox on Mac.
What Is Inspect Elements?
Inspect Elements is a powerful feature available on all modern web browsers that allows you to learn more about a webpage, like its structure, layout, and styling of it. Developers and online content designers often use these tools to debug, experiment, and troubleshoot a web project. You can easily select an element of a website, and the inspection tool will give all the information beneath a particular element, like the color, font, size, and other elements.
The inspection tool also allows you to modify the code temporarily and view the changes being applied to the webpage in real-time. However, the changes will only be visible to you. It is a powerful tool for you, whether you’re an experienced developer or just curious to learn how a particular website is built.
Tip: looking to switch from Chrome to Firefox as your default browser? We provide everything you need to ensure a smooth transition.
How to Inspect Elements in Google Chrome on Mac
Let’s start with how to inspect elements in Chrome, as it is the most popular browser. The steps are fairly simple, allowing you to get started in no time.
How to Open the Inspection Panel in Google Chrome
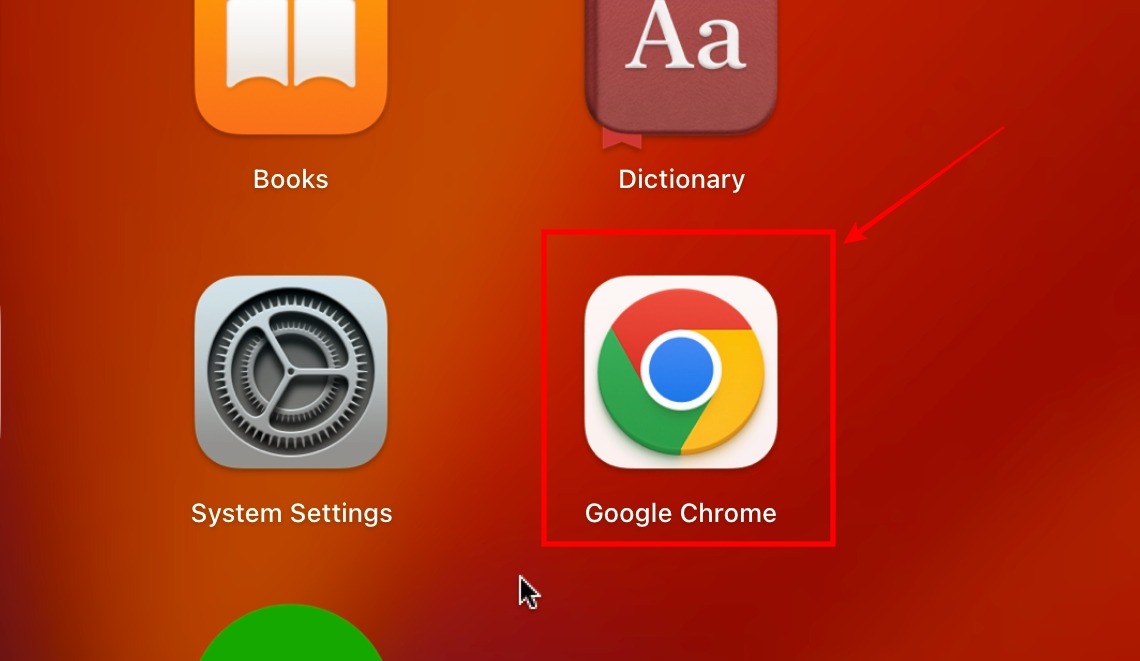
- Open the Chrome browser, and visit any website you’d like to inspect.
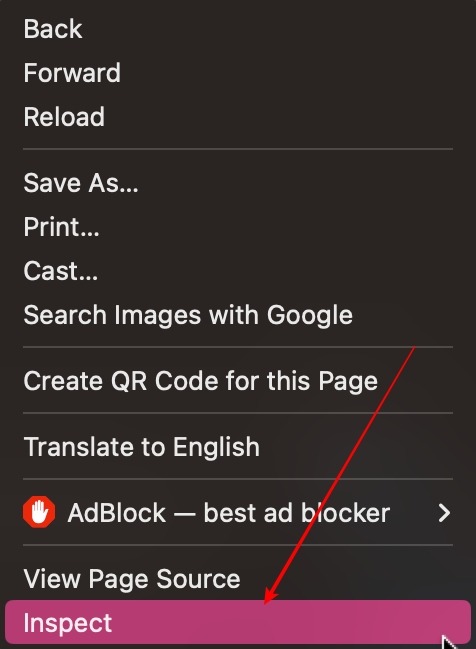
- Right-click on any blank space and select “Inspect.”
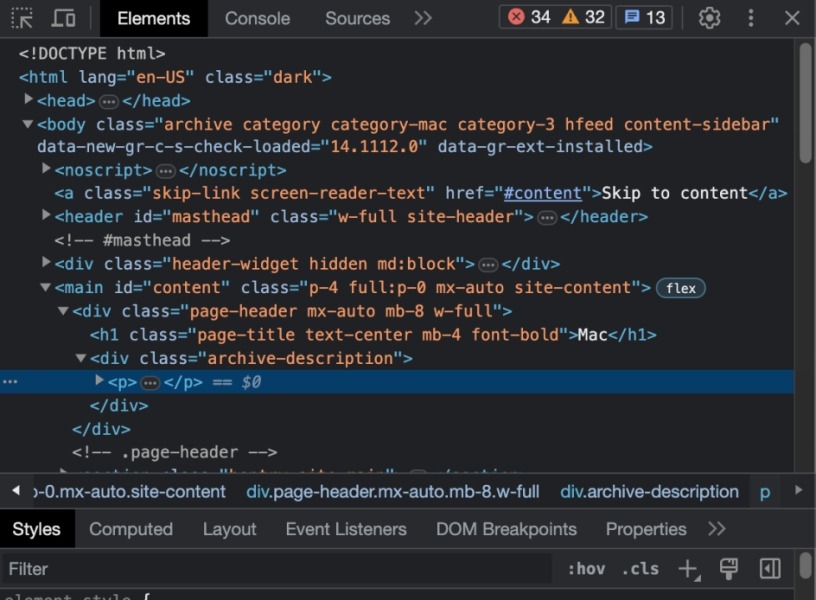
- You will see the inspection panel on your screen.
Good to know: not using Chrome for Mac? Discover how to use Google Chrome’s “Inspect” tool for website diagnostics on a Windows PC.
How to Inspect a Particular Element of a Webpage in Google Chrome
Now that you have successfully opened the inspection panel, let’s learn how to interact with an element.
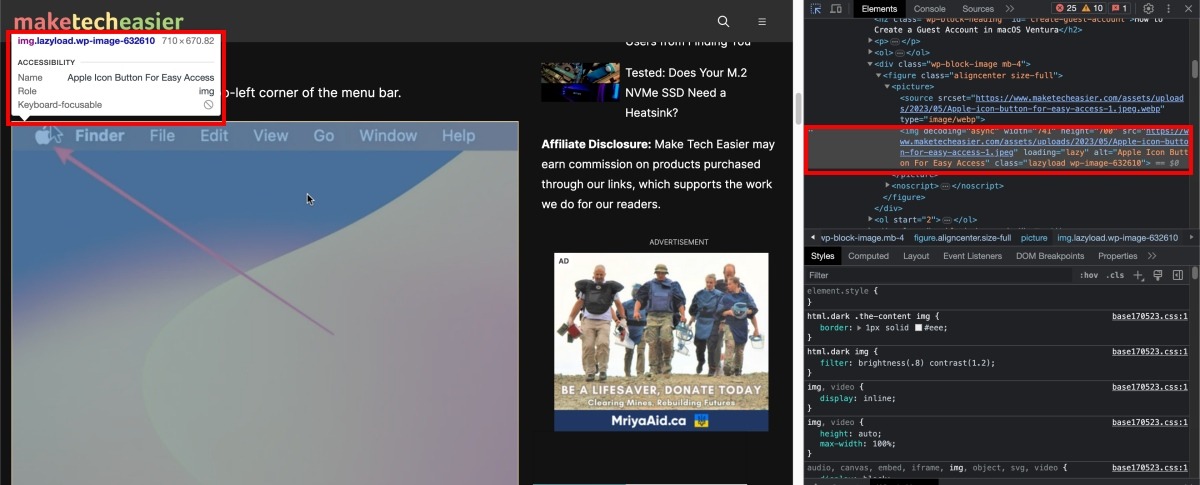
- From the left corner of the inspection panel, click on “Select an element to inspect it.”
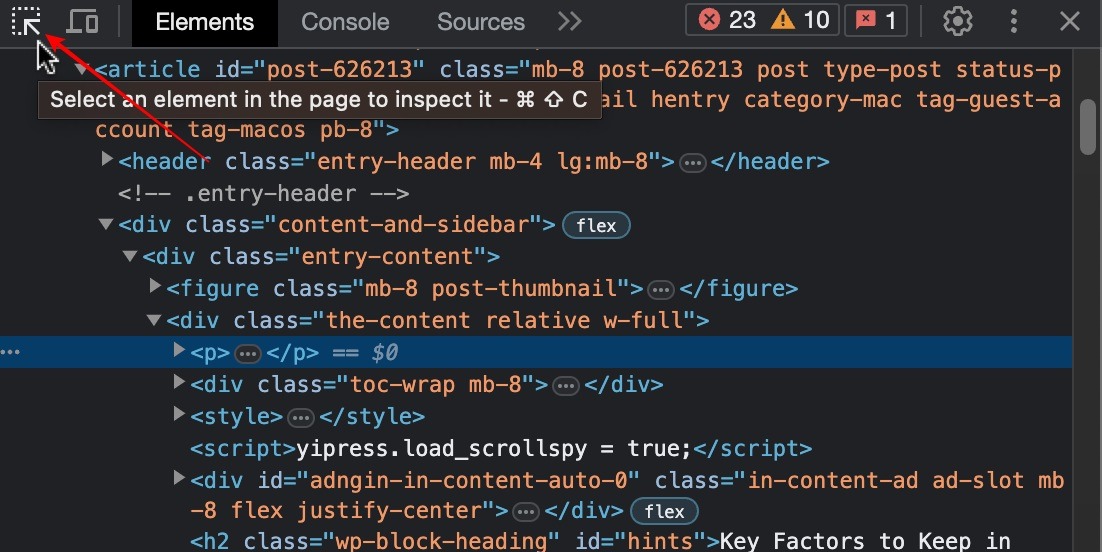
- Select any element. For this example, we’re inspecting an image on the webpage. You can do this with any element you would like. You will see a white box with some basic information, like the type of element, name of the file, etc. On the right side, you will see the code associated with the particular element.
How to View the Mobile Version of a Website in Google Chrome
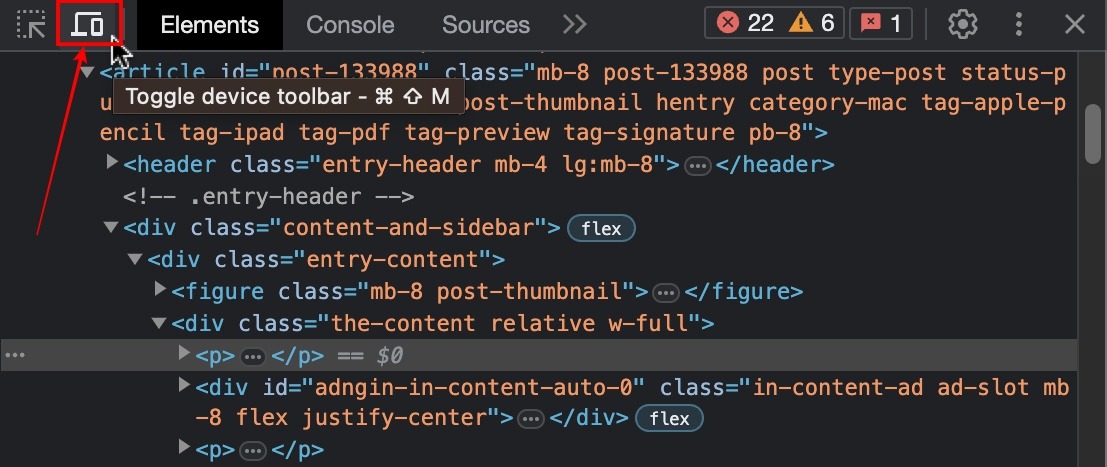
- From the left side of the inspection panel, click on the “Toggle Device Toolbar” option.
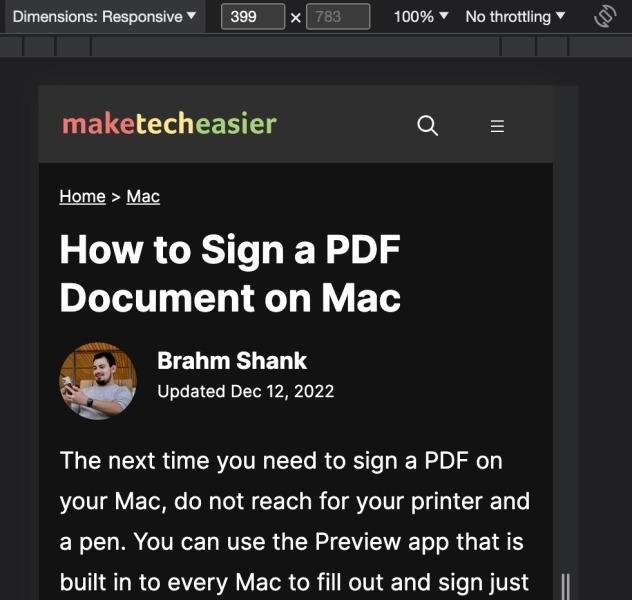
- You will see the website react on a mobile device. You can still perform your inspection by clicking on the element, and the information will be based on smartphones.
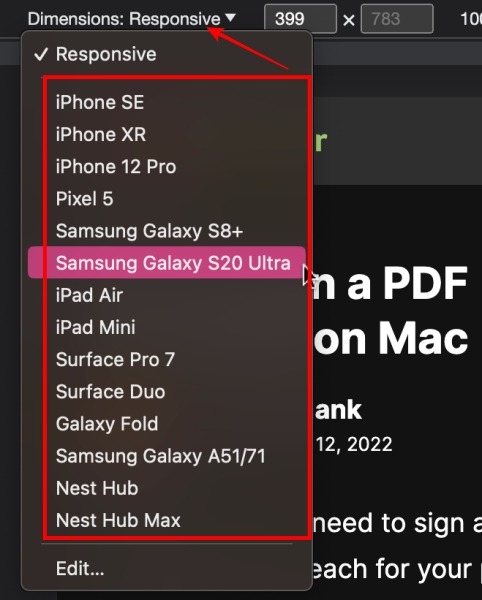
- If you click on the “Responsive” drop-down above, you can select a device of your choice from the list. When you do so, you will see how the webpage reacts to a particular smartphone model.
How to Change the Location of the Inspection Panel in Google Chrome
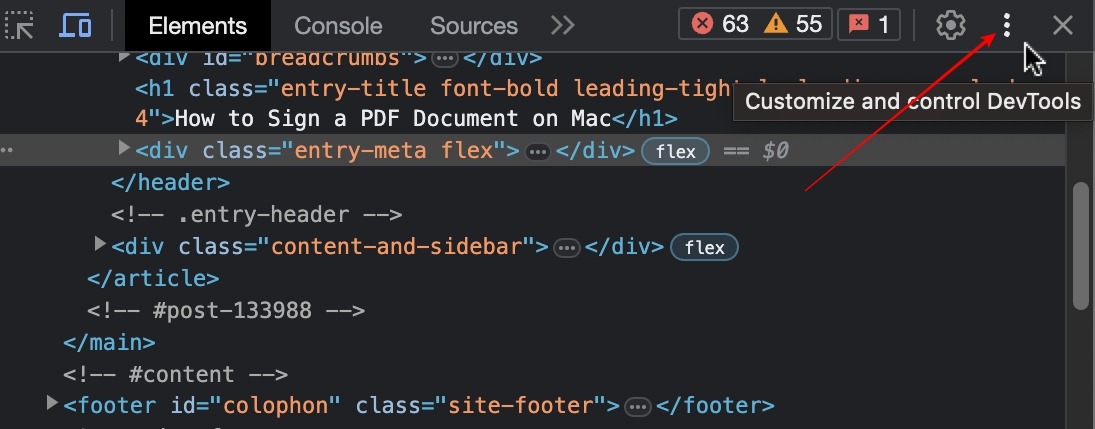
- Click on the vertical three-dot ellipsis from the right corner of the inspection panel.
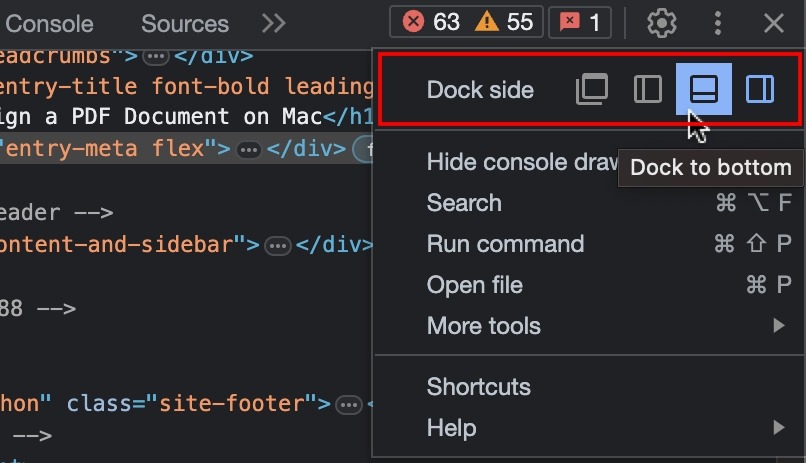
- Select the location for the inspection dock: on the left, below, or on a pop-up window.
How to Inspect Elements in Safari on Mac
The inspect elements feature is turned off by default on Safari, as it is a part of the developer option. So first, we need to enable the “Develop Menu.”
Tip: making the switch from Chrome to Safari as your default browser on your Mac? We have all the steps to help you transition without losing your favorite bookmarks, extensions, and more.
How to Open the Inspection Panel in Safari
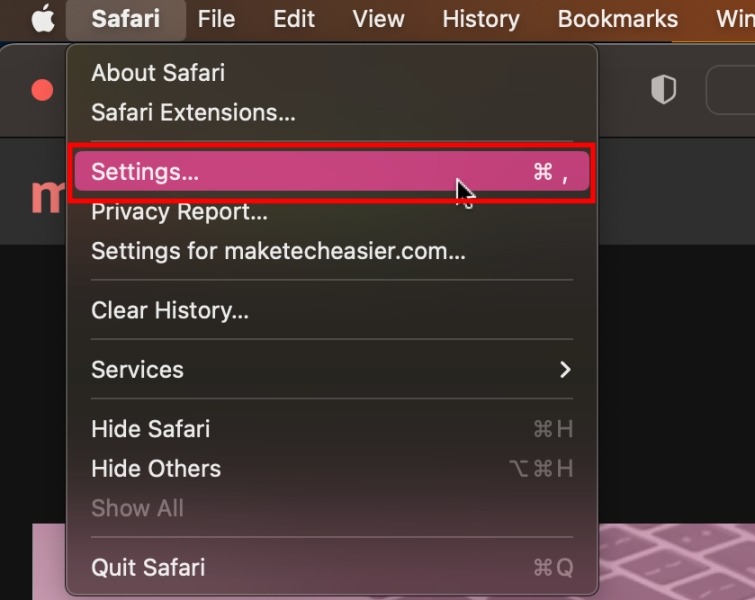
- Once you open Safari and are already on the website you want to inspect, click on the “Safari” icon in the top menu bar and select “Settings.”
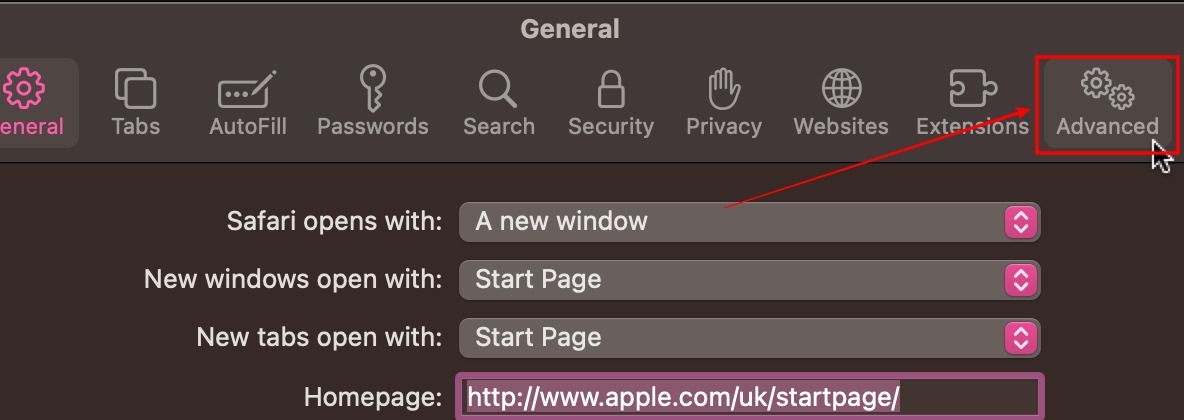
- This will take you to the “General” tab. Select the “Advanced” tab on the far right.
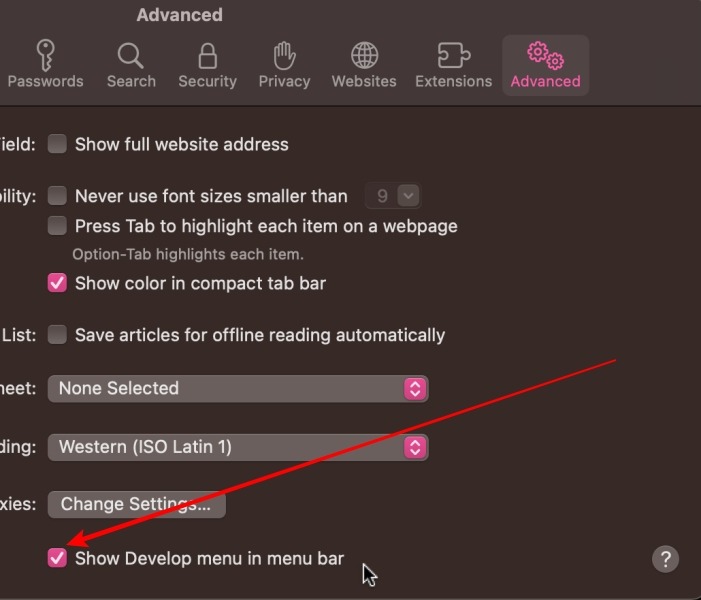
- Click the checkbox next to “Show Develop menu in the menu bar” to have access to all advanced features of Safari.
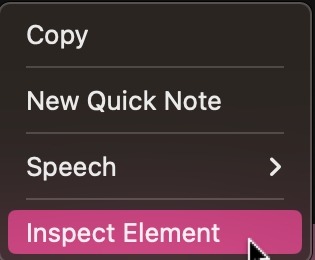
- Right-click anywhere on the website and select “Inspect Element.” This will open the inspect elements panel in Safari.
- For more advanced options, click on the “Develop” tab in the menu bar.

How to Inspect a Particular Element of a Webpage in Safari
- Click on the “inspect” icon that looks like a bullseye in the left corner of the inspection pane.
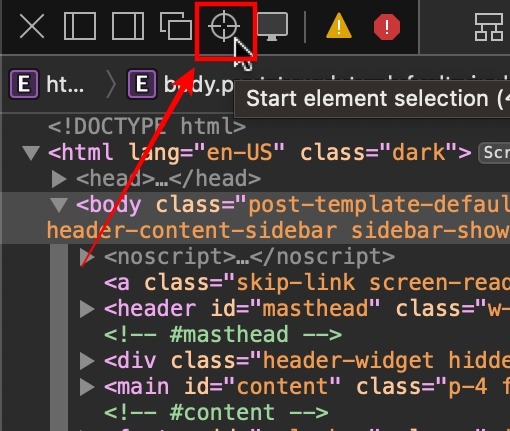
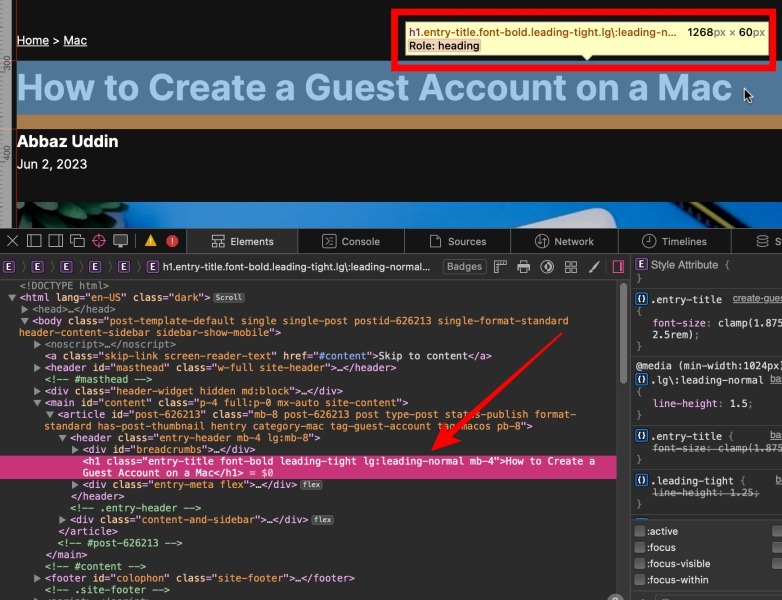
- Use your cursor and select the element you would like to inspect. We are inspecting the title tag for this example, but you can inspect any element you would like.
How to View the Mobile Version of a Website in Safari
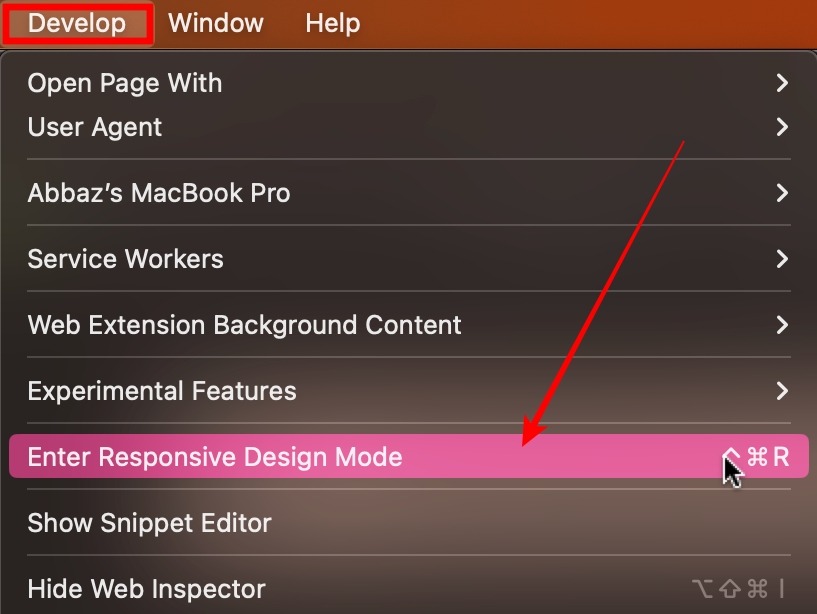
- From the top menu bar, click on the “Develop” option and select “Enter Responsive Design Mode.”
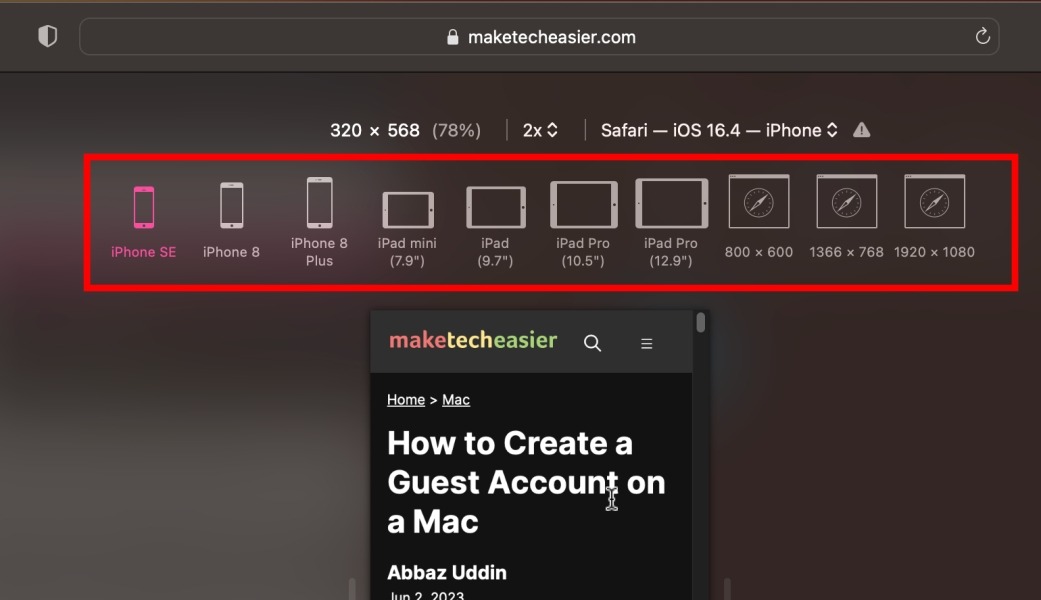
- Select any device model you want to use to inspect the webpage.
How to Change the Location of the Inspection Panel in Safari
From the left side of the inspection panel, select the location you would like, and the inspection pane will be moved accordingly.

How to Inspect Elements in Firefox on Mac
Firefox is a popular choice among seasoned developers and designers when working on web projects. Let’s see how we can inspect elements in Firefox on Mac.
How to Open the Inspection Panel in Firefox
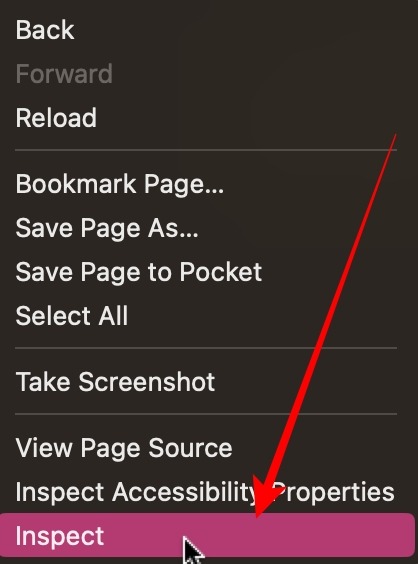
- Once you are on the webpage you want to inspect in the Firebox browser, right-click and select “Inspect.”
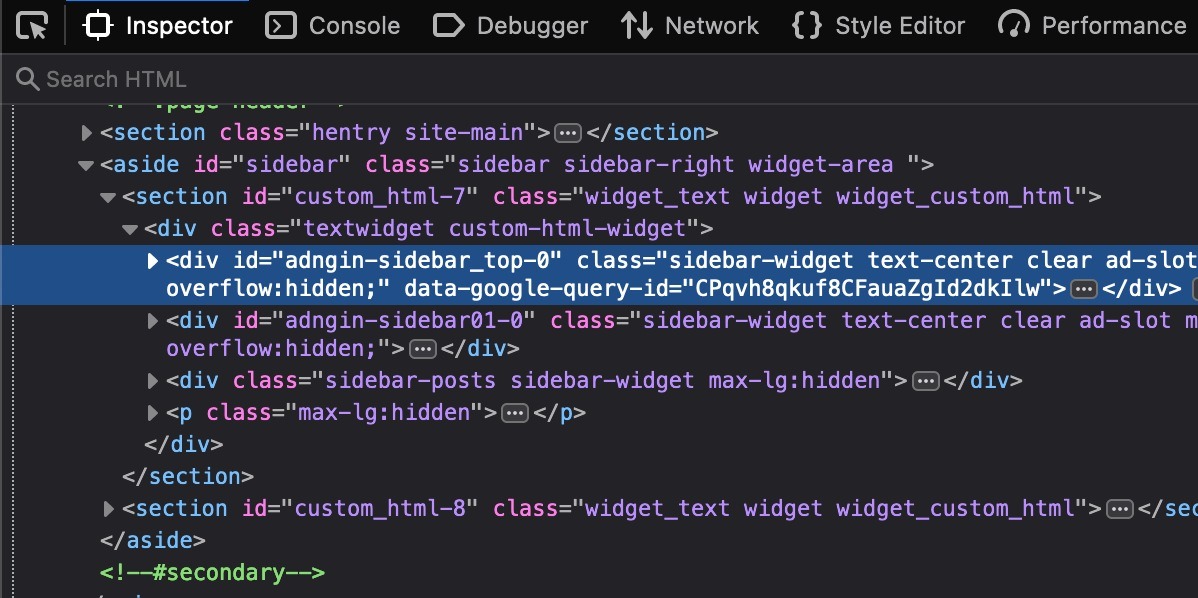
- This will open the inspection panel on the Firefox browser.
How to Inspect a Particular Element of a Webpage in Firefox
- Click on the “cursor” icon that you see in the left corner of the inspection panel.
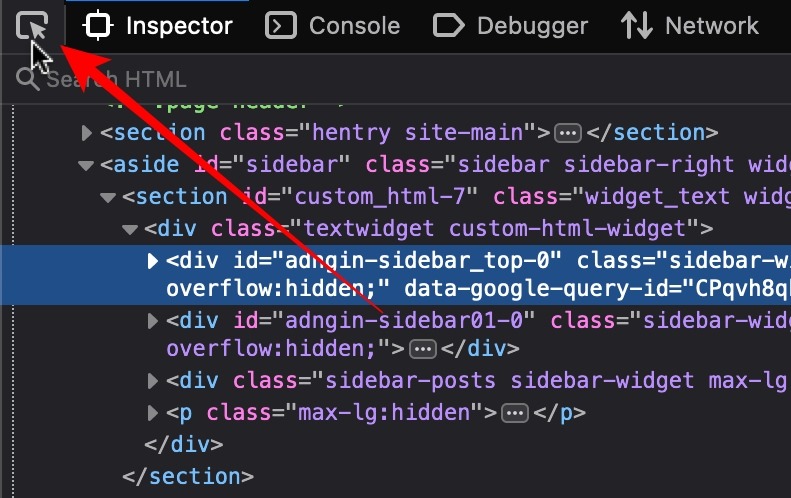
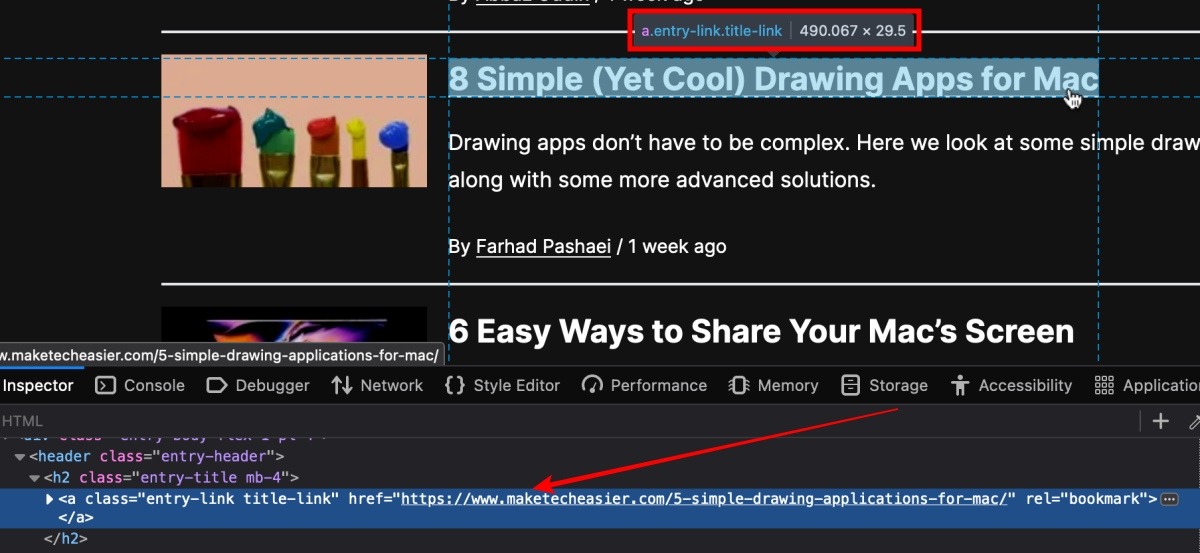
- Move your cursor to the element you’d like to inspect. For this example, we are inspecting a heading tag, but you can do this with any element you would like.
How to View the Mobile Version of a Website in Firefox
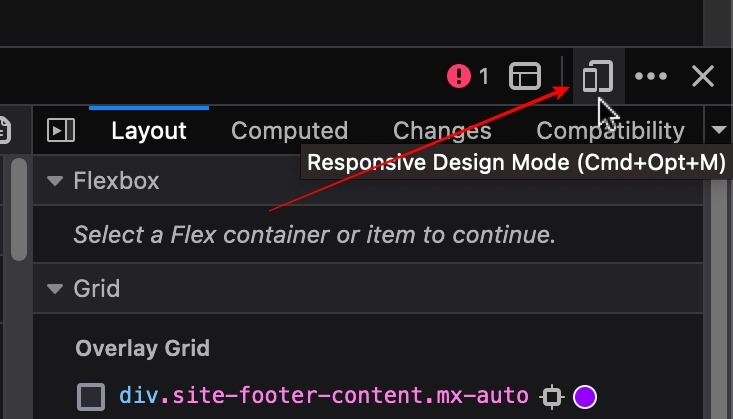
- From the right corner of the inspection panel, click the smartphone icon.
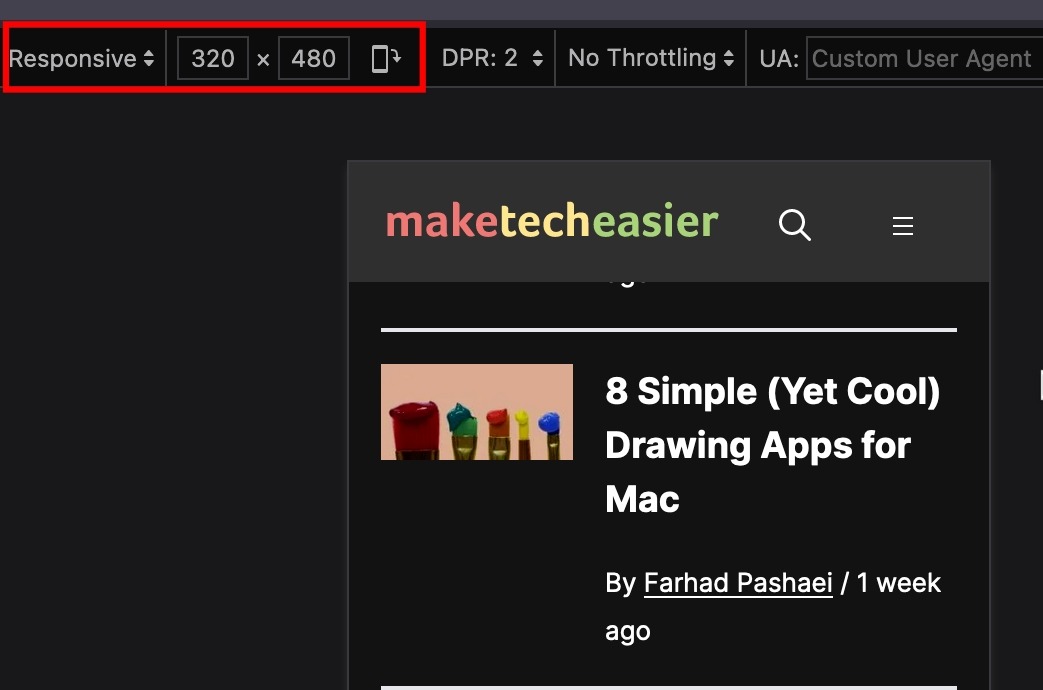
- This will convert and load the website into a smartphone-shaped viewer. You can click on the “Responsive” toggle to select a mobile device of your choice.
How to Change the Location of the Inspection Panel in Firefox
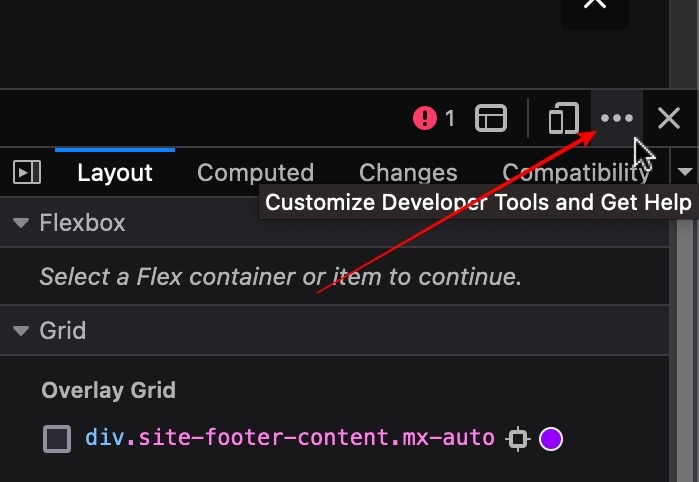
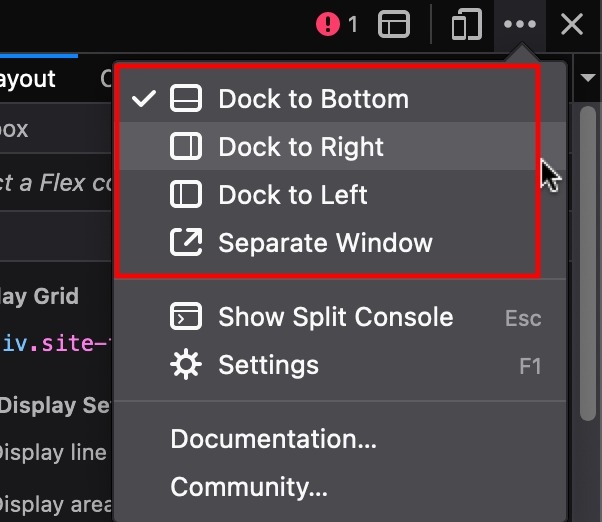
- Click on the horizontal three-dot ellipsis in the right corner of the inspection dock.
- Select the location you’d like to enable, and the inspection panel will be moved accordingly.
Frequently Asked Questions
How does inspecting elements differ from viewing the page source?
Inspect elements is a developer tool built into modern browsers to interact, modify, and troubleshoot a webpage for its HTML, CSS, and JavaScript. When you check the page source of a webpage, you simply see a static HTML code that was delivered by the server to the browser. You can analyze the overall structure, content, and tags, like the metadata, etc., but the inspection tool renders the webpage with all of its elements, corrects errors, and more.
Which other types of data can I discover from using the inspect elements tool?
With inspect elements, you get a comprehensive view of how a website is built. You gain access to the actual HTML code with hierarchy and nesting. You can modify the CSS and see the changes in real time, including elements like color, font size, etc. You can also see the JavaScript code, allowing you to debug the code and analyze it. The “Network Requests” feature makes it easier for you to understand the resources that are being loaded externally, like the Console Output fonts, DOM manipulation, and more.
Can website owners see inspect element activity on their websites?
Technically, yes. To clarify, all modern websites have analytics and other tracking tools installed, which essentially track everything that you do on a website, from how long you remain on the site to where you click. However, you will never be personally identified by the website, and you are simply a data point in a cluster of users that matches your demographic and behavior. These systems are in place to monitor the website’s performance and improve user experience.
Image credit: Unsplash. All screenshots by Abbaz Uddin.
Our latest tutorials delivered straight to your inbox